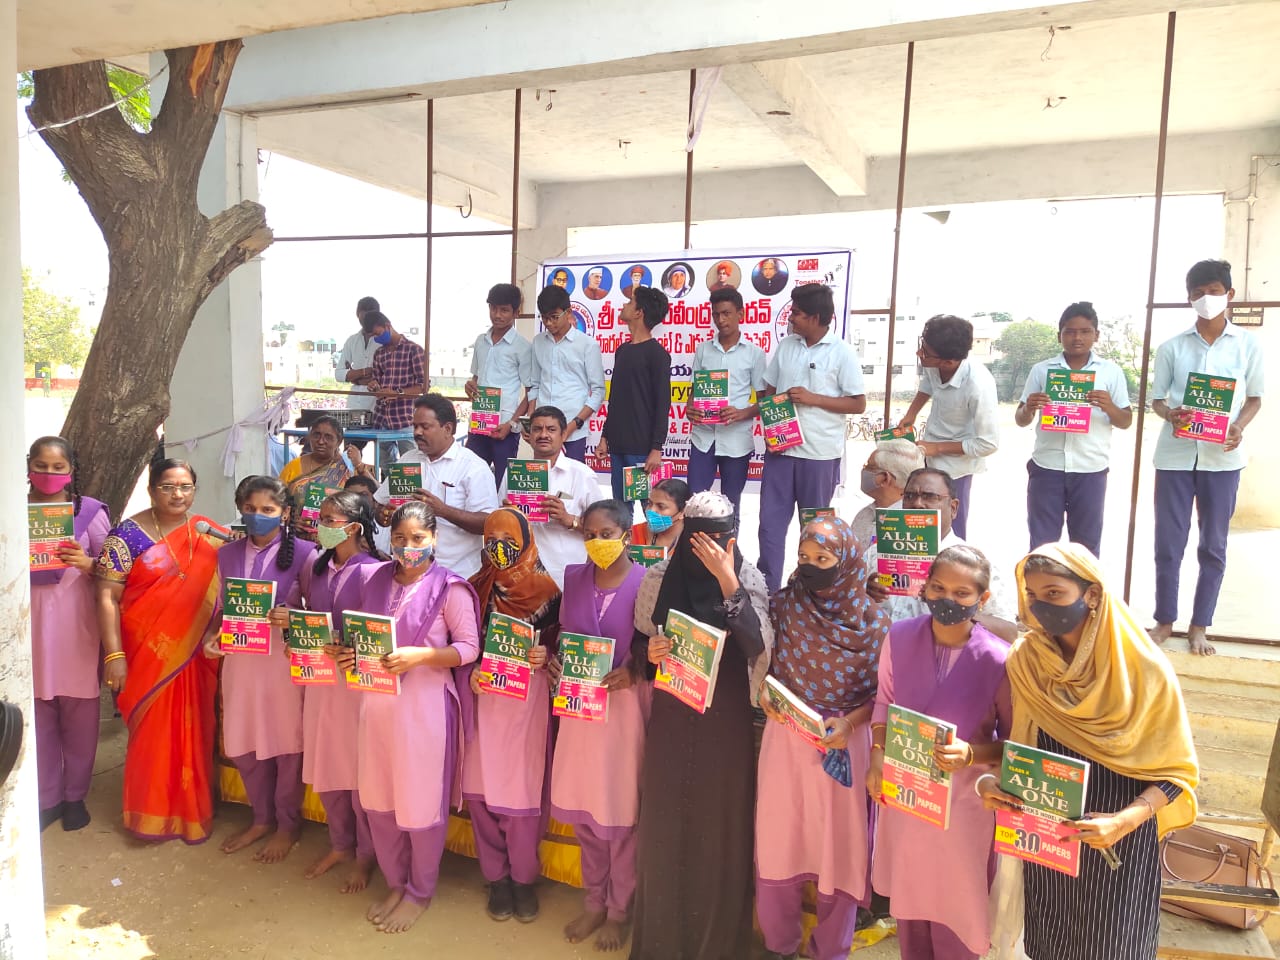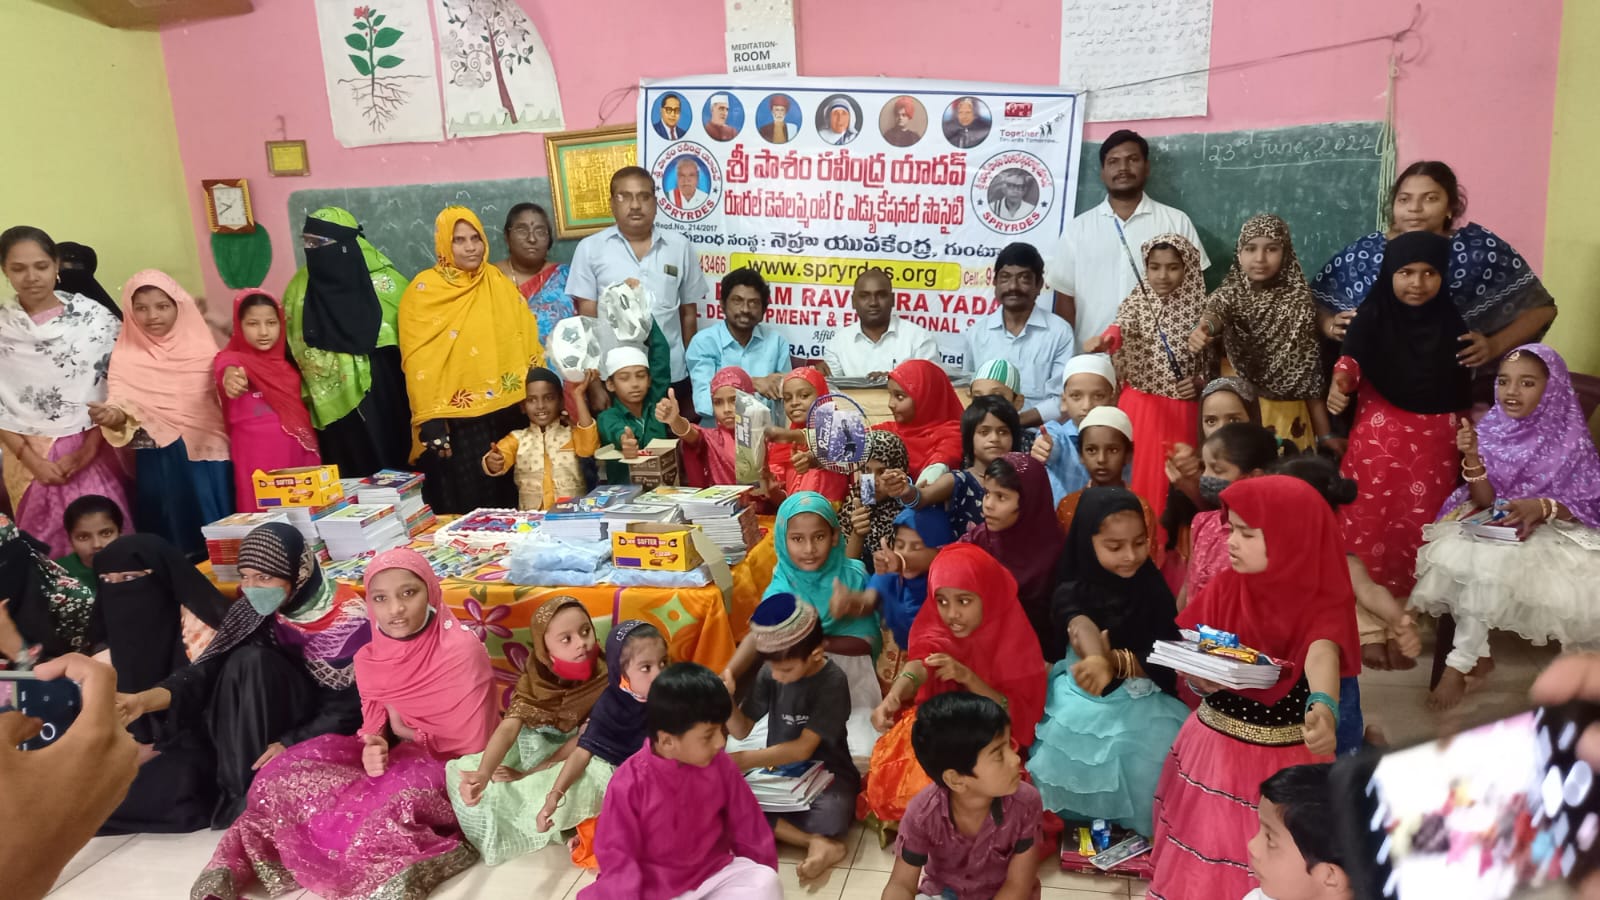
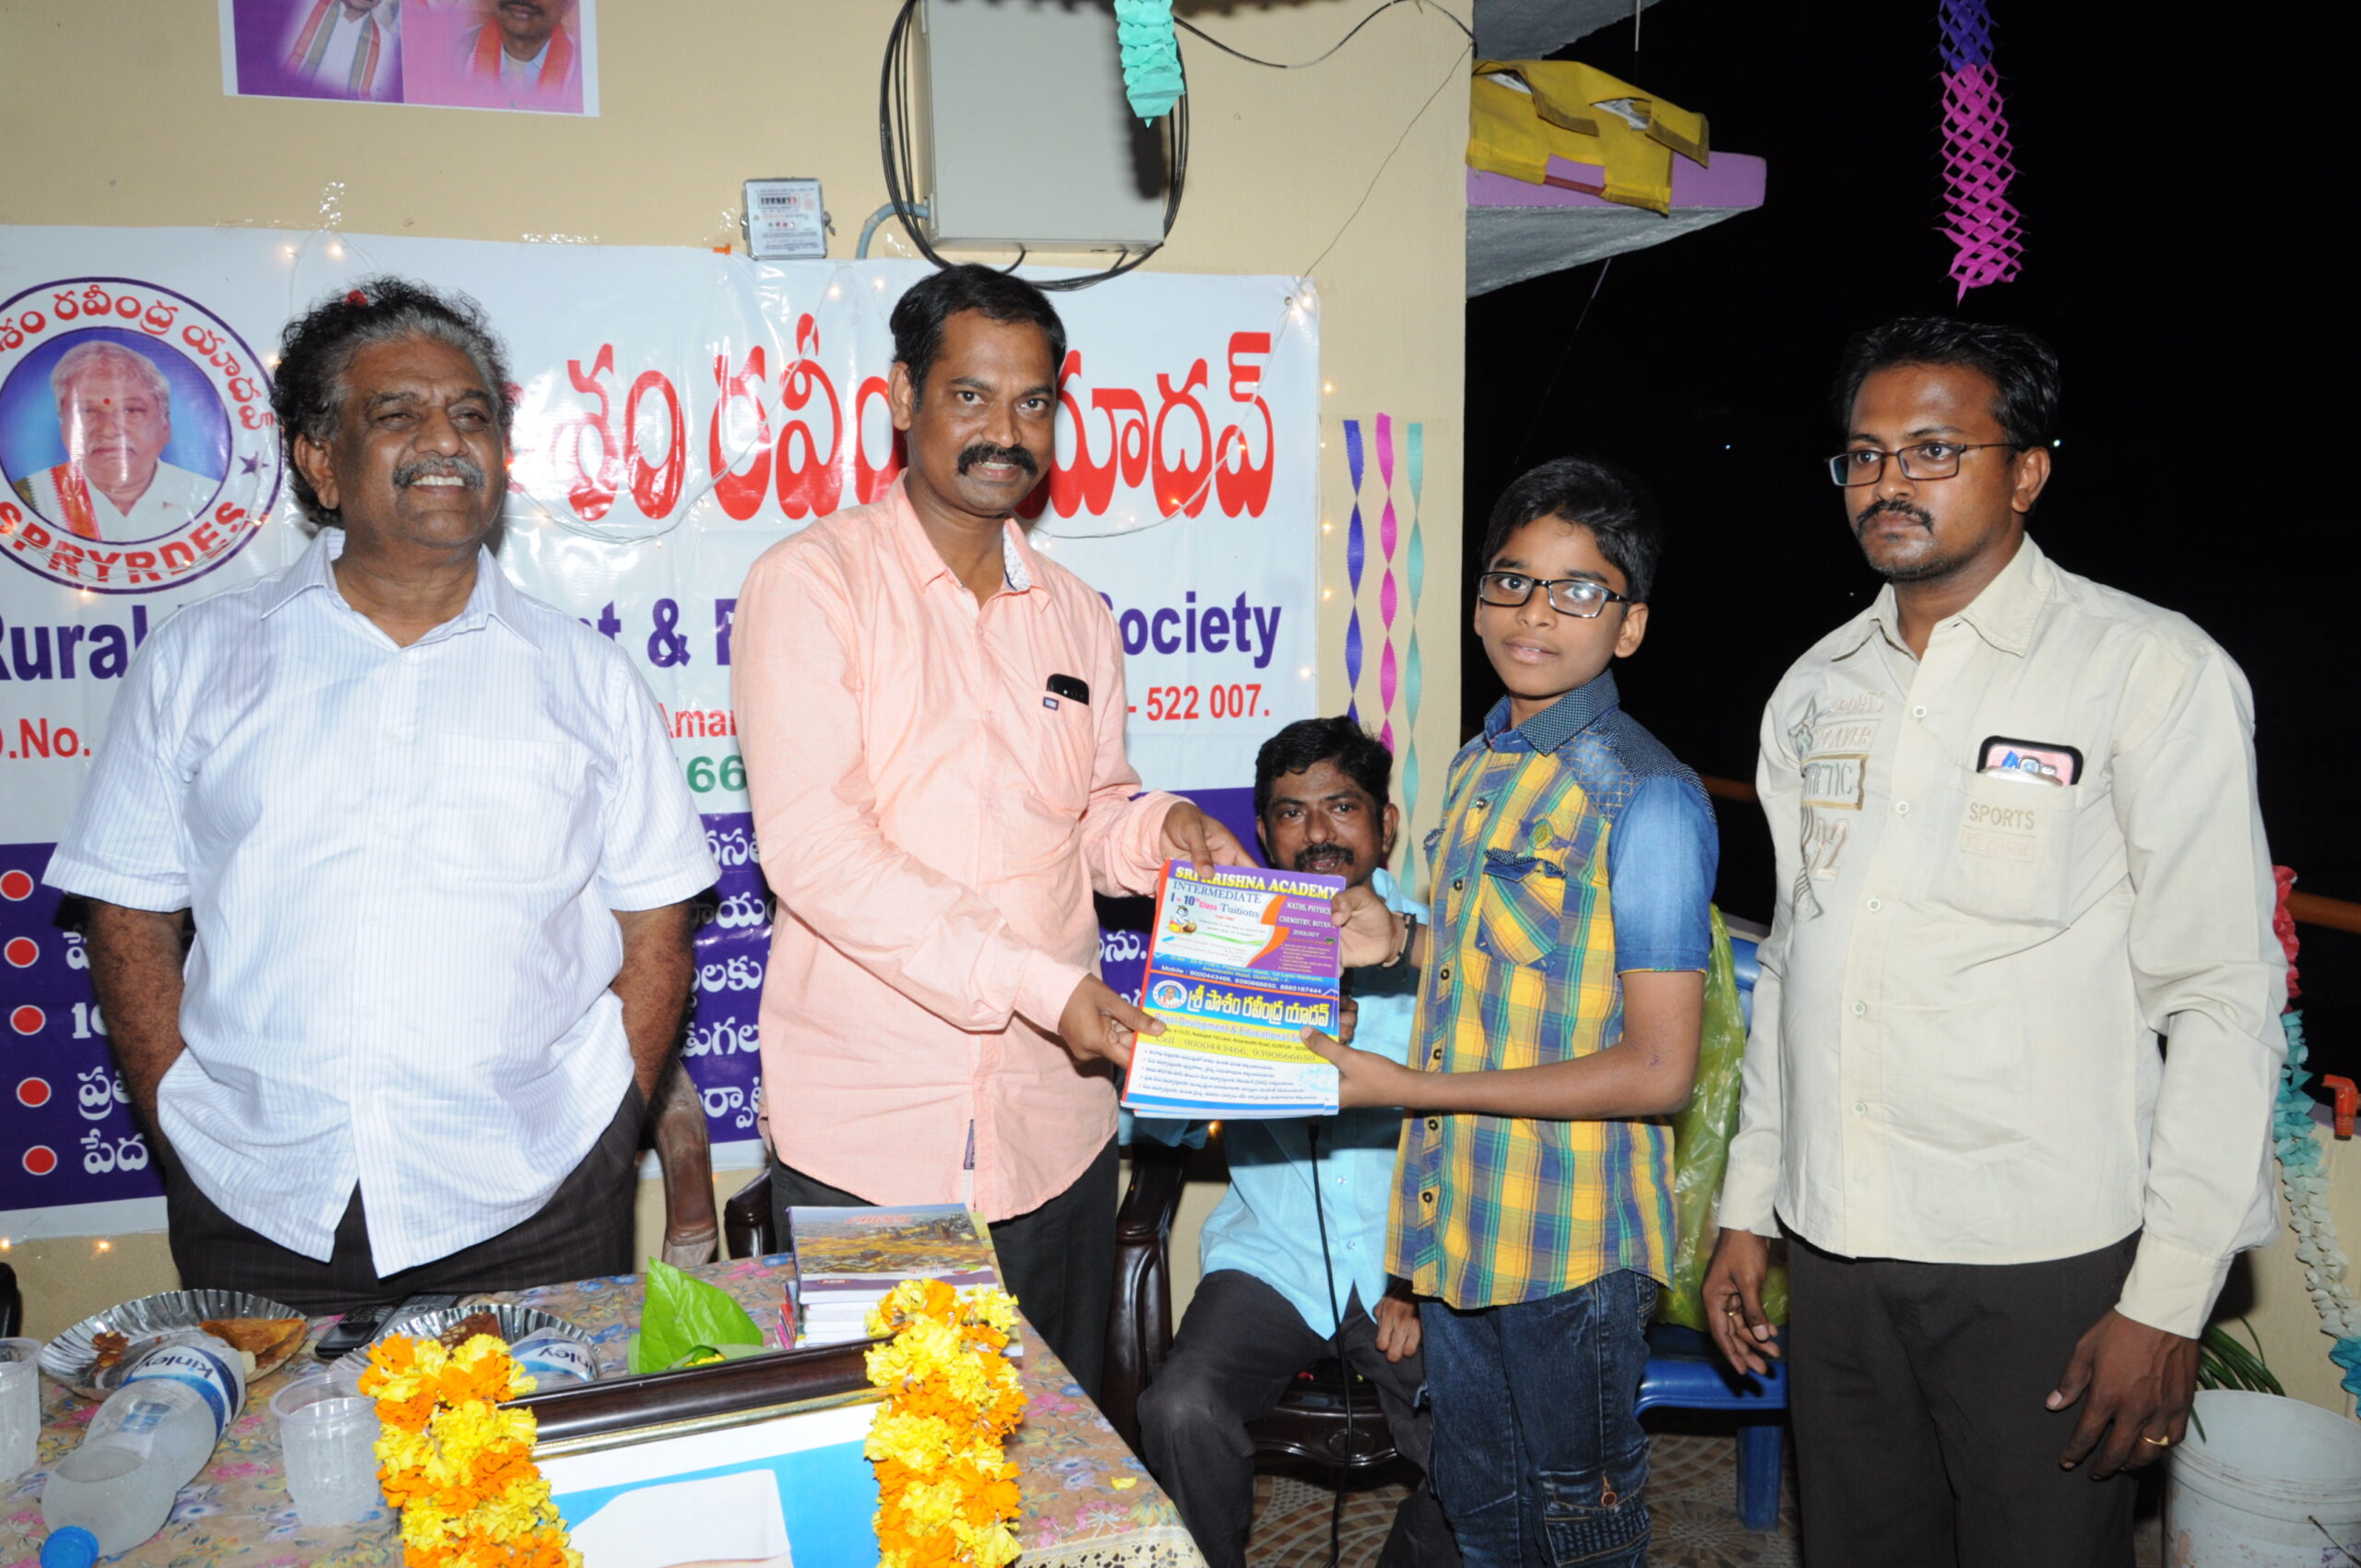
Distribution of Notebooks to Poor Students
We have Conducted the distribution of Notebooks at Guntur city Andhra Pradesh , India. Nation's strength lies in the Human Resources, for this we need educated people, then our nation can progress well.
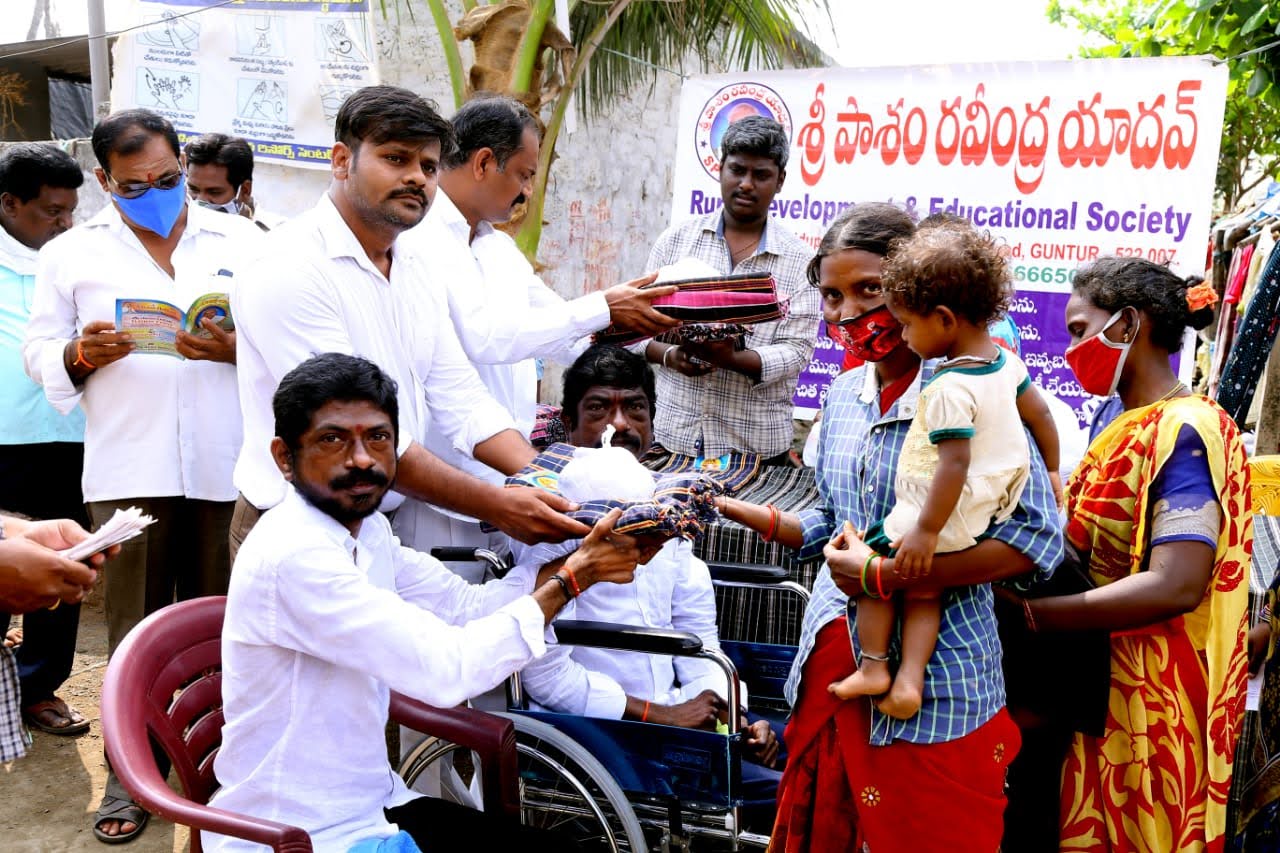
FEEDING TO STREET PEOPLE
We have Conducted for Feeding Program and Provided the Food packets and cloths to Street People at temples, Railway station Under Bridges and Busstand.
PLANTATION PROGRAM
In this Program our Organisation mainly Concentrated about the Plantation for the Healthy Atmosphere of the Surrounding People. This is very Essential program for the healthy nature and also convene concentrated about the cleanness of the Surrounding Environment
National Festival Exp
Our Organisation always Trying to faster the Nationalism, Discipline and Human values like Dedicated to work and self esteem.
MEDICAL AND HEALTH CAMPS
We conduct health camps on Malaria, Dengue and Viral fevers and Diabetics and Prevention of HIV/ AIDS in Guntur city.
ORPHANAGE HOME MAINTAIN
We are in Medication to provide Sustainable support on the primary and upper primary education to the Rural poor belong to the downtrodden communities.
AGED WELFARE PROGRAM
We have conducted Aged welfare Program at Naidupet, Guntur city it runs Psychological programmes and workshops for Diceased bed ridden
CULTURAL ACTIVITIES
We Arrange Cultural Programms on the eve of National Festivals to promote Patriotism. So that the society stands united with national Spirit.